Collective Intelligence: the example of the agency Sarthe Tourism with the support of Stat & More to enhance and automate the processing of Orange Flux Vision™ data for the entire department and for the benefit of local tourist offices.
Introduction
The analysis of tourist flows in a dynamic territory like the Sarthe requires technical mastery and innovation capabilities.
Sarthe Tourism and ten local tourist offices engaged Stat & More to design a fully automated report model based on mobile data from Orange Flux Vision™. This article dives into the methodology, key results from the 2024 annual report, and the customer impact of such an approach.
1. Data serving territorial tourism
Working with Orange Flux Vision™ data means Stat & More handles several million lines of data collected over a full year in the department and for each study area. This data is supplemented with information provided by Sarthe Tourism, such as major events of interest for the agency. This large volume of data is processed for each area of interest by producing:
- An Excel file of summary results,
- A set of attendance maps (html and jpg formats) at departmental level with details of EPCI*, national and international levels,
- A finalized analytical report in PowerPoint format.
The automation of these productions (Excel, maps, reports) guarantees speed, reliability, and customization for each partner tourist office.
This automation was made possible thanks to a collaborative work between Stat & More and Sarthe Tourism, initially focusing on Sarthe Tourism’s needs. Finally, based on the definitions of the variables of interest documented by Orange Flux Vision™, the collaboration ensures that the delivered results are consistent and meet the expressed requirements.
These summary reports enable Sarthe Tourism and the various local Tourist Offices to:
1. Report to elected officials and tourism stakeholders about past tourist and excursionist activity in their geographic area,
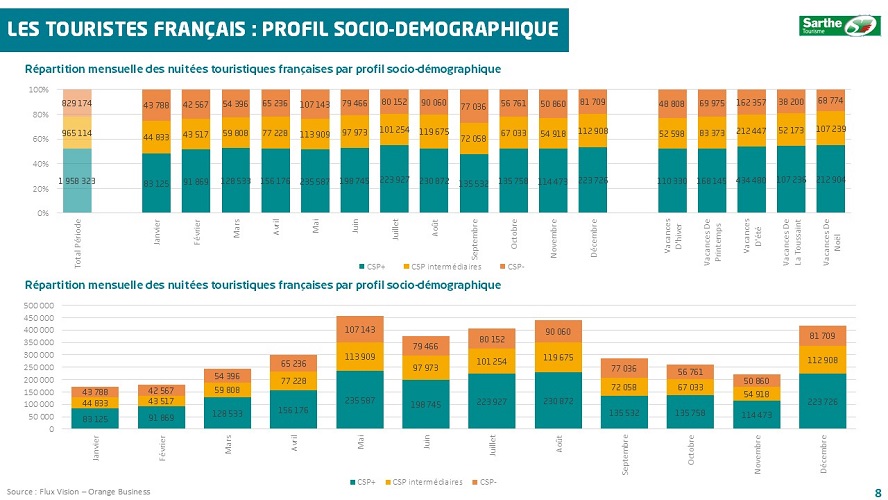
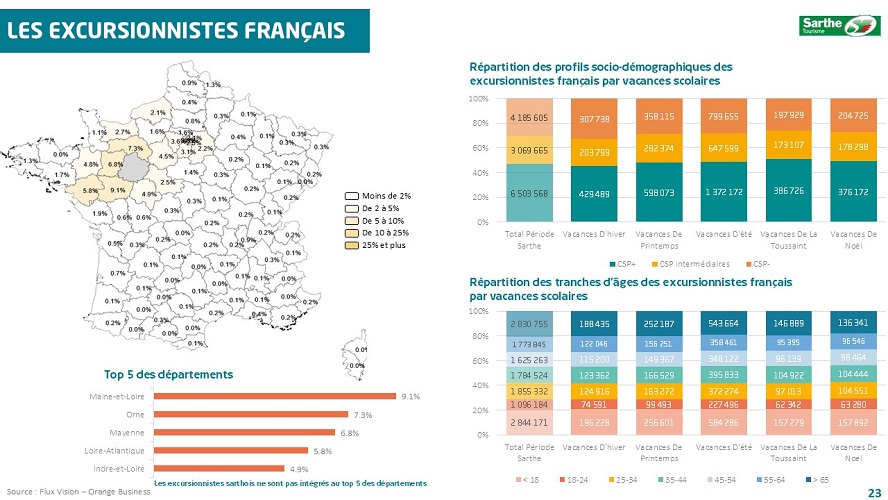
2. Conduct targeted marketing actions by adapting communication campaigns (message, media used) according to the socio-demographic characteristics of the target (geographic origin, age group, Socio-Professional Category),
3. Support project leaders of tourism activities by providing quantified data on tourist attendance by geographic area.
2. 2024 Annual Report: attendance, profiles, and origins
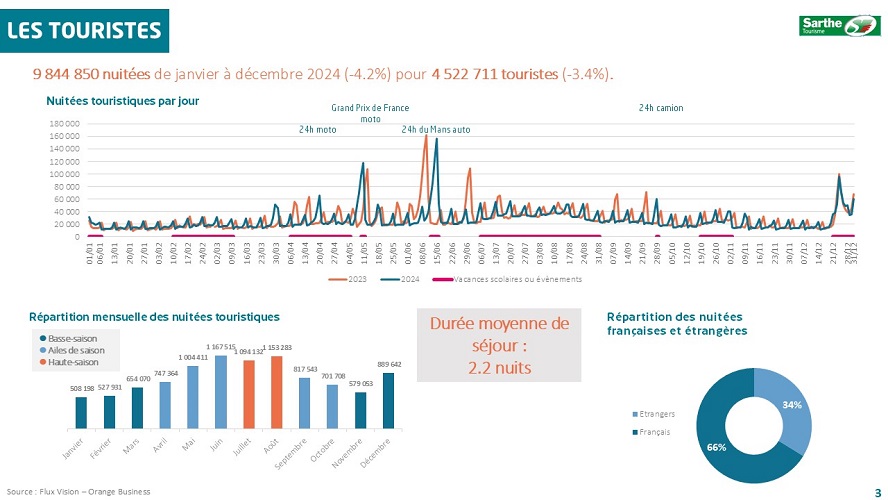
“In 2024, the Sarthe welcomed nearly 4.5 million tourists for a total of 9.8 million tourist nights, both French and foreign combined. The average length of stay is 2.2 nights. The data, derived from the Orange Business Flux Vision® solution, allows a fine and territorialized observation of tourist flows, with deliverables adapted to the various geographic zones of the department for precise activity management.”
Tourist attendance
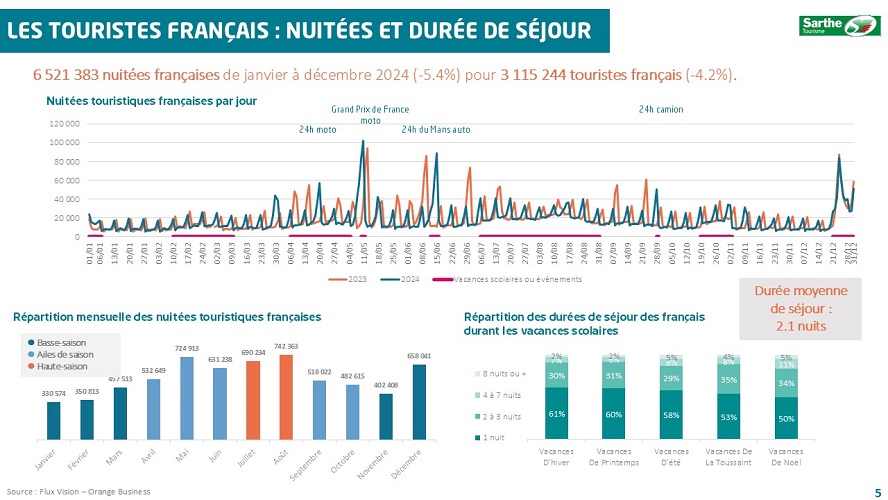
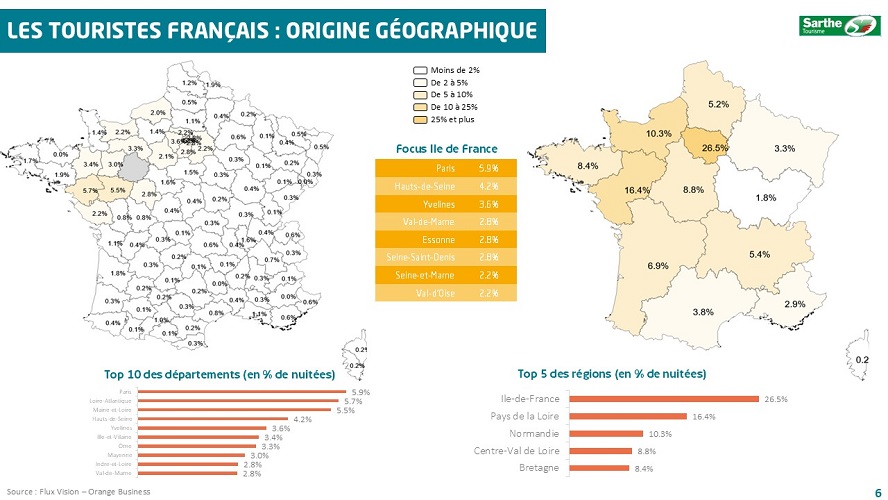
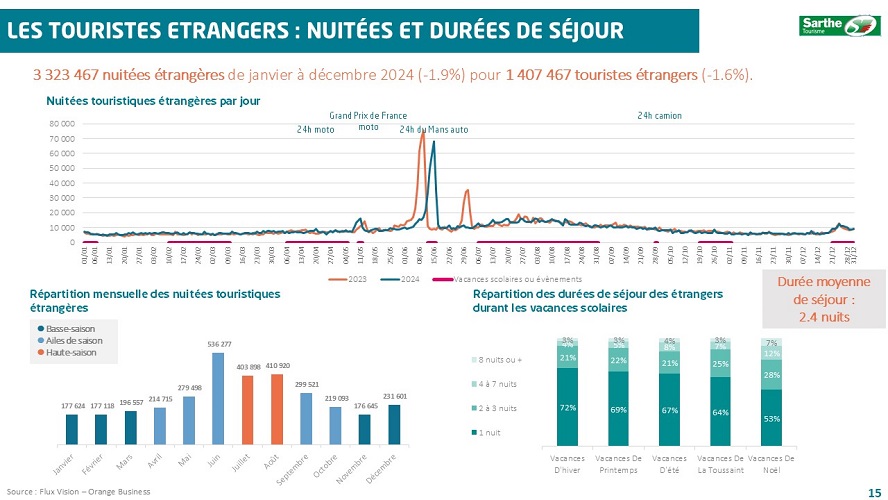
✓ Hosted tourists: Sarthe welcomed approximately 4.5 million tourists in 2024 for a total of 9.8 million tourist nights (commercial and non-commercial), representing a 4.2% decrease compared to 2023.✓ Tourist origins: 66% of nights are French, 34% foreign. The French customers accounts for 6.5 million nights, mainly from Île-de-France.
✓ Length of stay: the average duration is 2.2 nights per stay.
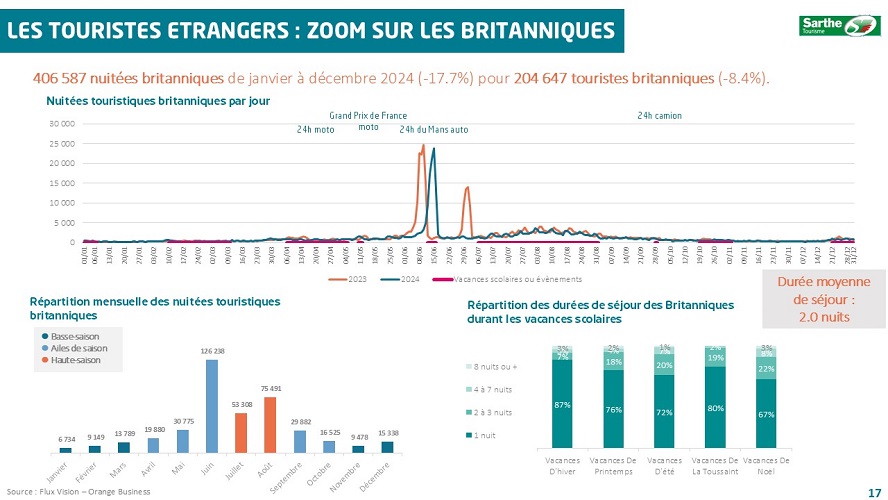
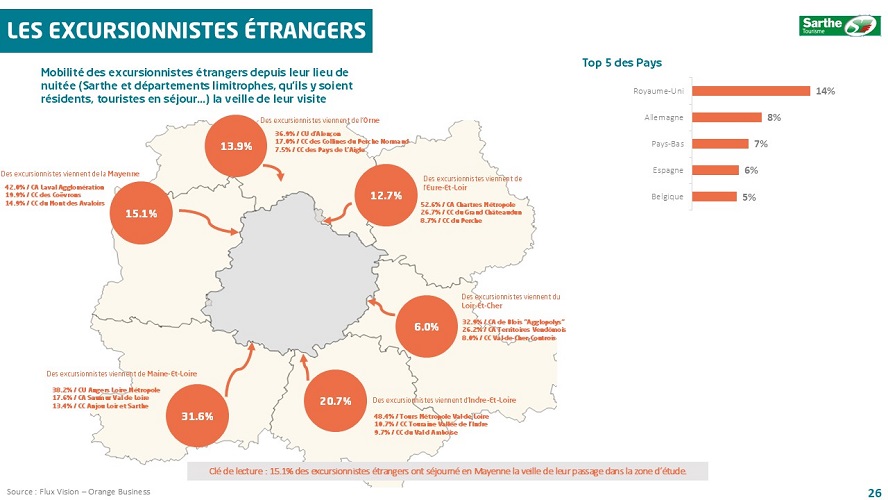
✓ Foreign tourists: The main origins are the United Kingdom (12.3% of foreign nights), Germany, the Netherlands, and Belgium.
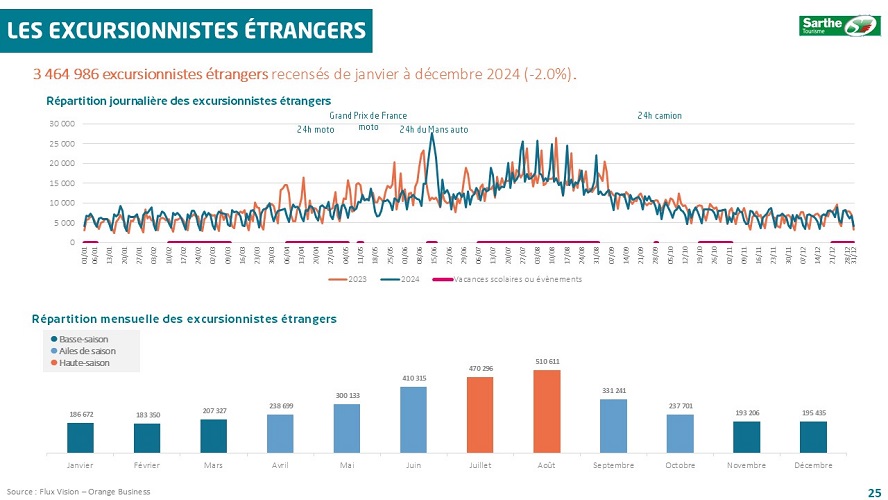
✓ Seasonality and events: Attendance peaks during major events such as the 24h of Le Mans, the motorcycle/car Grand Prix, school holidays....
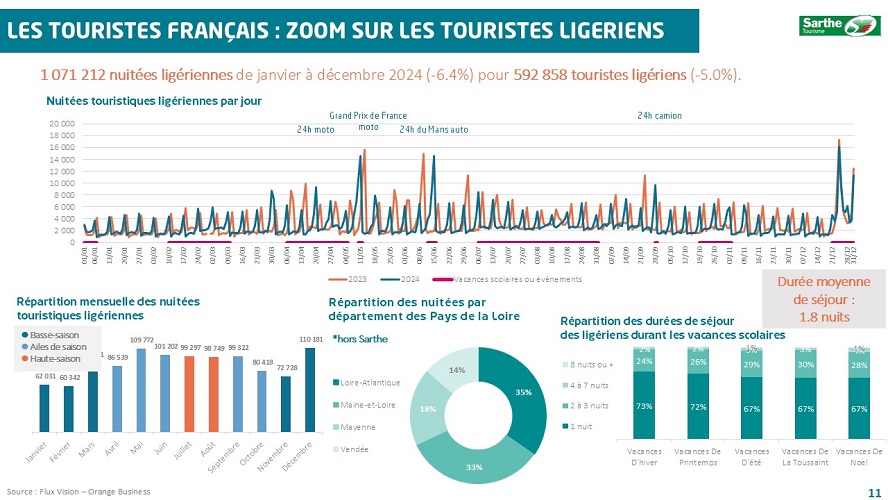
✓ Local variations: Some areas like the Alpes Mancelles or Sillé Plage show specific attendance profiles, e.g., a high share of foreign nights or unusual seasonality.
Excursionist attendance
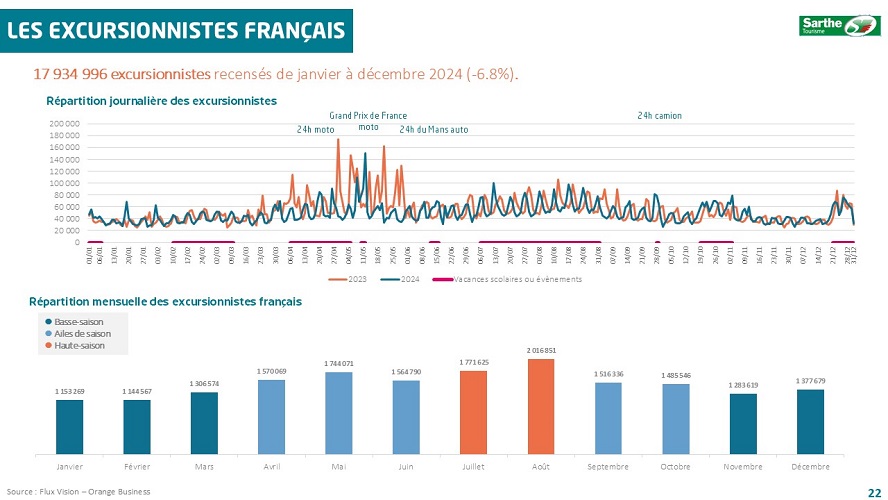
✓ Excursionist volume: Nearly 21.4 million excursionists were recorded in 2024, down 6.1% from 2023.✓ Distribution: Excursionist attendance varies by zone and period, with peaks notably during major events and school vacations.
✓ Seasonality: Excursionists are more present on weekends and during holidays, especially near attractive sites and local events (e.g., the Bugatti circuit during the Grand Prix).
✓ Regional origin: Many excursionists come from neighboring departments (Mayenne, Maine-et-Loire, Orne, Eure-et-Loir, Loir-et-Cher, Indre-et-Loire), but the dynamic remains very local.
✓ Foreign excursionists: British, German, Belgian, and Dutch visitors also figure among foreign excursionist visitors, often for short stays around major tourist sites.
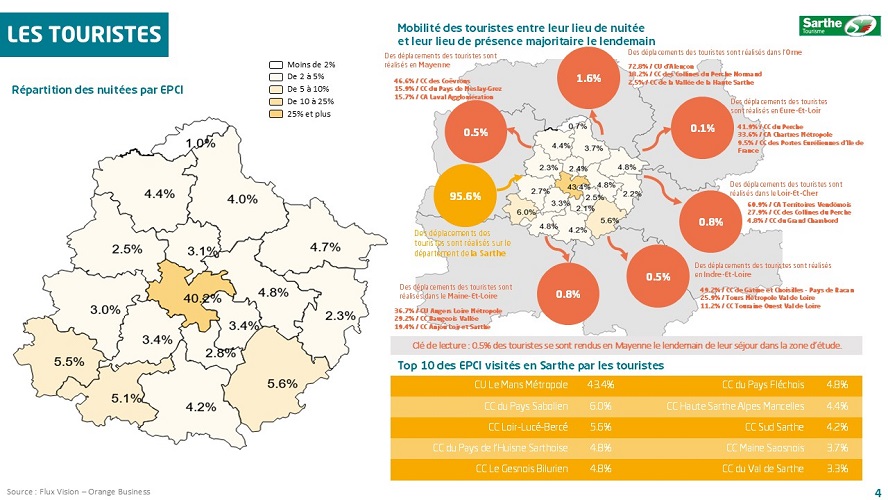
Attendance mapping
Spatial analysis relies on thematic maps that finely illustrate the distribution of nights by zone, accessible in html or jpg formats for presentations.
Mapping allows spatial visualization of the distribution and intensity of tourist attendance, offering an immediate reading of territorial dynamics. It effectively complements traditional graphs by adding a geographic dimension, thereby facilitating the identification of attractive zones or flow concentrations. Mapping enhances understanding and communication of results to different audiences.
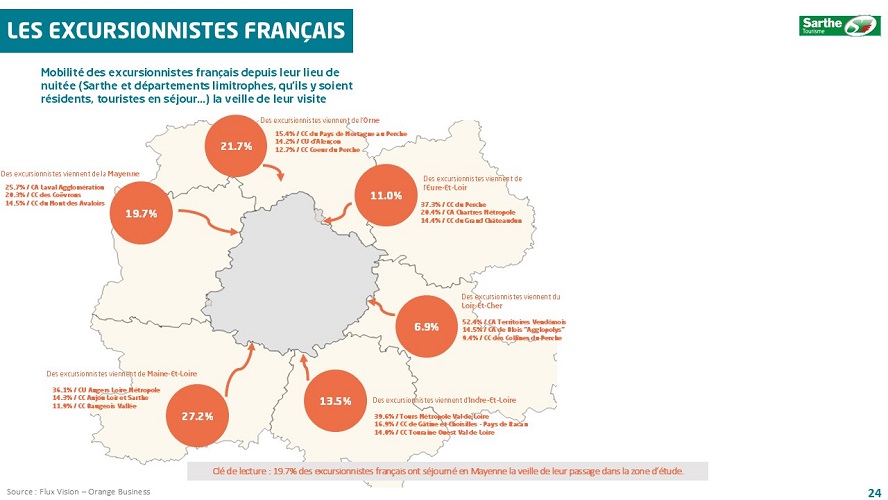
Excerpt from the 2024 Annual Report on the Sarthe department
Technical points
- The figures come from Orange Flux Vision™ aggregated files, cross-checked with local tourism censuses and observatories, based on millions of data lines and maps integrated into the reports.
- Stat & More ensures the automation of the processing, guaranteeing quick access to accurate indicators for each studied area.
- This report is produced at the departmental level and replicated about ten times for each customer needing this summary for their own territory.
3. Data science, Business Intelligence, and deliverable automation
The core of the partnership between Sarthe Tourism and Stat & More is based on the following pillars:
- Massive data processing: numerous csv files provided by Orange Flux Vision™ for each geographic zone and on many criteria are made available to Sarthe Tourism and Stat & More every 2 months.
- We guarantee the consolidation of data throughout the project’s lifetime by keeping the history of consolidated data in a unique database per geographic zone.
- We control data and processing to ensure the integrity of delivered results. It may happen that Sarthe Tourism or Stat & More detect anomalies in the source data which we report back to Orange Flux Vision™ for corrections or adjustments.
- Using documented scripts with different production platforms (Python and VB) allows us to generate Excel files, maps, and PowerPoint reports while ensuring perfect reproducibility of outputs over time or space.
The industrialization of processing enables relatively fast and reproducible production of deliverables for each studied zone, maximizing added value for tourism sector customers.
4. Customer benefits: territorialized data and democratization of access to results
1. Global and detailed vision: Each tourist office receives results adapted to its zone while benefiting from an overall departmental view.2. Easier dissemination: Deliverables (PDF reports, html/jpg maps, Excel files) are designed to circulate widely among elected officials, local tourist offices, economic tourism players, press…
3. Data coaching: Stat & More supports local teams for understanding indicators, particularly when creating the reporting template.
These solutions allow tourist offices to access territorialized and reliable data, have automated and personalized deliverables adapted to their local challenges, while benefiting from a consolidated vision at the departmental scale. They facilitate strategic decision-making, optimize communication of results to elected officials and local actors, and contribute to more effective and proactive management of tourist flows.
Conclusion
“The collection, analysis, and visualization of territorialized data are major levers to effectively manage tourism policies. Data visualization tools improve understanding of tourist flows, optimize strategic decision-making at local and departmental levels, and facilitate communication between public and private actors.”
The partnership between Stat & More and Sarthe Tourism places data and Business Intelligence at the heart of modern tourism management, offering tourist offices a turnkey solution to manage their activity, enhance their areas, and innovate in analysis dissemination. Territorialization of tools and automation of deliverables pave the way for intelligent, rigorous, and shared management serving all local stakeholders.
Are you a departmental development agency, a tourist office, or a sector actor? More generally, do you need attendance data to manage your activities?
Explore the potential of your data combined with the Orange Flux Vision™’s data, benefit from personalized support, rich and accessible deliverables, and position yourself as a pioneer in territorial business intelligence.
Send an email to Stat & More for a tailored study and a demonstration of geolocated data automation and visualization solutions.
ACKNOWLEDGMENTS :
We would like to extend our special thanks to Sarthe Tourisme for the trust they have placed in us in our ongoing collaboration and also for giving us permission to write this article based on our joint work.
REFERENCES:
1. Sarthe Tourism. (2025). Tourist Attendance Report 2024. https://www.sarthetourisme.pro/bilan-de-frequentation-touristique-2024
2. Sarthe Tourism. (2025). Tourist figures and trends in Sarthe [LinkedIn Publication]. https://fr.linkedin.com/posts/sarthetourisme_chiffres-et-conjoncture-touristiques-en-sarthe-activity-7366456804140032001-XvK_
3. OECD. (2024). Tourism Trends and Policies 2024. Paris: OECD Publishing. https://www.oecd.org/cfe/tourism/tourism-trends-and-policies-19991119.htm
4. World Tourism Organization (UNWTO). (2023). Tourism Data for Sustainable Development. Madrid: UNWTO. https://www.unwto.org/publications/tourism-data-for-sustainable-development