
Measuring the strength of a brand beyond awareness. A brand’s strength is reflected in its ability to be spontaneously cited, recognized, considered, purchased, desired, and also in the quality of the mental universe it builds over time.
The strength of a brand cannot therefore be reduced to simple visibility.
In a context where brands are becoming increasingly similar, competition is intensifying, and consumers are making more demanding trade-offs, measuring brand performance today requires a more refined approach than a simple awareness score.
This is precisely the objective of our methodology: to transform a set of declarative, behavioral, and perceptual signals into a clear, robust, and actionable reading of brand strength.
Why awareness is no longer enough?
For a long time, awareness served as the central benchmark in brand studies. It remains a useful indicator, of course. But it does not tell the whole story.
- One brand may be widely known without being truly chosen.
- A second brand may be regularly purchased without holding a strong place in consumers’ minds.
- A third brand may have a highly distinctive image territory without yet reaching a high level of reach.
In other words: being a well-known brand is not the same as being a strong brand.
This nuance, which is strategically essential, guides our approach.
A more complete view of brand performance
To assess brand strength, we combine several complementary dimensions:
- spontaneous awareness
- aided awareness
- first brand cited spontaneously
- recent purchase
- familiarity
- consideration
- an overall perception score
- and when this score is not directly collected, a reconstruction based on dimensions such as resonance and desirability.
To this are added brand image associations, which go beyond traditional declarative measures to explore the very structure of perception.
This combination provides a more faithful reading of reality: not only who is known, but also who is present, who is chosen, and why.
Model reading framework
Here is a simplified representation of the overall logic.

This diagram illustrates the basic principle of this brand performance analysis: multiple indicators are combined into a synthetic score, while image <-> brand associations feed a more granular understanding of the brand territory.
A method rooted in data science
Behind this approach lies a modeling logic similar to LDA-type methods (Linear Discriminant Analysis). Without going into detail, the idea is to extract latent dimensions from heterogeneous signals and then synthesize them into an overall indicator of brand strength or brand performance.
This logic is particularly relevant when working with rich but non-uniform survey data. It makes it possible to:
–> Structure responses of different natures,
–> Capture underlying relationships between variables,
–> Stabilize market interpretation,
–> And produce a comparable score across brands.
In practice, this means we do not simply add up indicators. We model a brand reality.
Richness and uniqueness: the quality of brand territory
Not all brands establish themselves in consumers’ minds in the same way. Some have a rich, dense, evocative territory. Others, on the contrary, are known but perceived in a more generic way.
This is why we also analyze image associations along two particularly useful dimensions:
-
Richness :
Richness measures the density of associations linked to a brand. It reflects a brand’s ability to open up a varied, structured, and vibrant interpretative universe. -
Uniqueness :
Uniqueness measures how distinctive this universe is. A brand can be rich without being unique; it can also be unique without yet being widely developed. The challenge is often to find the right balance between depth and distinctiveness.
These two dimensions provide highly valuable insights for marketing teams: they help distinguish a simply visible brand from one that is truly embedded in its own imaginative territory.
Example output: synthetic ranking
Here is a simplified example of output.
| Brand | Spontaneous Awareness |
Recent Purchase |
Consideration | Richness | Uniqueness | Synthetic Score |
|---|---|---|---|---|---|---|
| Brand A | 78 | 42 | 71 | 64 | 55 | 82 |
| Brand B | 65 | 51 | 68 | 58 | 49 | 73 |
| Brand C | 54 | 36 | 59 | 73 | 76 | 69 |
| Brand D | 31 | 18 | 35 | 81 | 84 | 61 |
In this example, Brand A dominates in overall strength, but Brand D stands out with a highly distinctive image territory despite lower awareness. This type of reading is particularly useful for brands in a development or repositioning phase.
Example output: brand profile
A more advanced output can also take the form of an axis-based profile.
Brand C
- Awareness: average
- Purchase: low to moderate
- Consideration: solid
- Familiarity: improving
- Richness: high
- Uniqueness: very high
In summary: a brand with strong differentiation potential, still under-optimized in reach
This type of output allows a shift from a simple overall score to a true strategic interpretation.
Example output:
Richness vs Uniqueness positioning map
Another way to present results is to position brands on a two-axis plane.
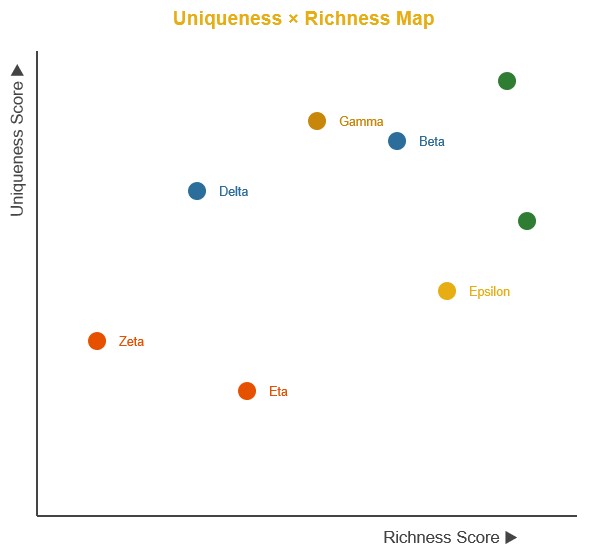
This type of visualization makes it very quick to identify each brand’s strengths and areas for improvement.
The real challenge is not just to rank brands, but to understand why they are where they are. This insight is what gives value to the analysis.
What the output delivers in practice
Our output is designed to support decision-making. It goes beyond a simple descriptive snapshot.
It notably makes it possible to:
- Position brands relative to one another,
- Understand what drives their strength,
- Identify priority activation levers,
- Detect gaps between visibility and perceived value,
- And inform communication, repositioning, or development decisions.
This approach is particularly relevant when multiple brands coexist within the same portfolio, or when a brand seeks to better understand its position in a dense competitive environment.
A tool for marketing leadership
Marketing teams need tools that are both rigorous and engaging.
- Rigor, to secure decisions.
- Engagement, to align stakeholders around a clear perspective.
Our approach meets both requirements:
–> It relies on a robust statistical foundation,
–> It presents results in a clear and understandable language,
–> It highlights truly useful trade-offs,
–> And it helps build a more lucid brand strategy.
In a context where decisions must be fast, well-argued, and consistent, this type of insight becomes a real asset.
What we deliberately keep proprietary
Like any high-value methodology, this approach relies on modeling, calibration, and assembly choices that we do not publicly disclose.
This is a deliberate choice.
It allows us to share the general logic while protecting what makes our work unique. Our customers are not just looking for an indicator. They are looking for a method, a perspective, and the ability to turn complex data into useful decisions.
We master this know-how and make it known by enabling a broad community of customers and prospects to benefit from a high-performing brand performance analysis tool that is robust and proven with major marketing leaders. What you have been waiting for, we now make available to as many people as possible: this technology, these analyses.
For which use cases is this approach most relevant?
Our framework is particularly suited when you want to:
- Assess the true strength of a brand,
- Compare several brands within the same category,
- Measure gaps between awareness, usage, and desirability,
- Understand image territories,
- Identify sources of differentiation,
- Track the effects of a brand strategy over time.
It applies equally well to consumer brands and more technical offerings, as long as survey data captures these perception dimensions.
Want to go further?
If you are looking for a more refined, structured, and strategic approach to brand measurement, we can support you.
We design tailored solutions to:
- Build a synthetic brand strength score,
- Integrate awareness, consideration, purchase, and image dimensions,
- Analyze the richness and uniqueness of brand territories,
- And present results in a clear, elegant, and directly actionable format.
Let’s discuss your case
Would you like to discuss a specific case, structure brand tracking, or audit your brand performance in a comparative framework? Contact us today to discuss your challenges and build together a measurement framework that is truly useful for managing your brand.
To learn more about our research and analysis methodologies, explore our articles on the Stat & More blog.
You can print this article for your records, or download a concise and highly operational PDF summary prepared for you.
REFERENCES :
✔ (2024, November 4). Harvard Business School Online: Brand Equity Explained: How to Build and Measure Success https://online.hbs.edu/blog/post/brand-equity
✔ (2023, September 5). QuestionPro: Brand equity: what it is & how to measure it https://www.questionpro.com/blog/brand-equity/
✔ Dzyabura, D. et al. (2020). Visual Elicitation of Brand Perception. Wharton Marketing. https://marketing.wharton.upenn.edu/wp-content/uploads/2020/01/01.23.2020-Dzyabura-Daria-PAPER.pdf