TURF Analysis based on MaxDiff outputs: A Powerful Combination for Maximizing Preference Share in the current competitive business landscape, designing the right product or serice by making the right feature decisions.
At Stat & More, we specialize in leveraging advanced data techniques to guide organizations in selecting the most valuable features for their products and services. One of the most effective approaches we use is combining MaxDiff (Maximum Difference Scaling) with TURF (Total Unduplicated Reach and Frequency) analysis. This powerful duo enables businesses to not only identify the most preferred features but also determine the optimal combination that will maximize reach and impact.
In this article, we will explain how MaxDiff and TURF work together, and how using these methods can significantly enhance your decision-making process.
The Objective: Optimizing Feature Selection
When designing a new product or service, businesses often test various features to understand customer preferences. However, the challenge is not only identifying which individual features are preferred, but also determining the optimal combination of features that will attract the widest audience and provide the greatest preference share.
MaxDiff analysis helps in ranking features by preference, while TURF analysis takes this a step further by identifying which combinations of features will maximize overall reach and preference share. Together, these methods provide actionable insights into feature prioritization and product design.
This approach is, for example, very useful for identifying a sub-group of claims to be used to communicate about a product or service, whether on packaging or in an advertising campaign.
MaxDiff Methodology: Identify preferred products/services features
MaxDiff is a choice-based approach widely used to understand relative preferences for a set of features. In a MaxDiff survey, respondents are presented with sets of features and asked to select which they most and least prefer. The result is a ranking of features based on the extent to which they are favored over others.
How MaxDiff Works?
✔ Survey Design : Respondents are for example shown groups of 3 to 5 features from a larger list and are asked to choose their most preferred and least preferred options. Respondents have to answer this question several times based on an experimental design specially created to balance features appartion and interaction (orthogonal design).
✔ Data Collection : Respondents answer these set of questions usually online. These choices are then aggregated across all respondents to create a preference score for each feature using hierarchical Bayesian model.
✔ Preference Ranking : The analysis output produces a relative preference ranking, identifying the most and least desirable features. As MaxDiff approach is a derived measure, this method avoids bias and problems of scale use like Likert or simple numeric scales. This approach makes it a highly reliable method for assessing preferences.
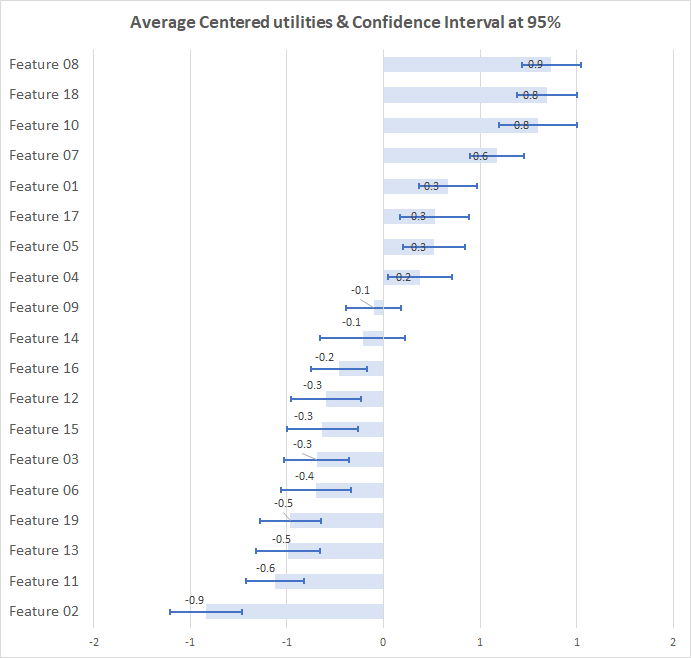
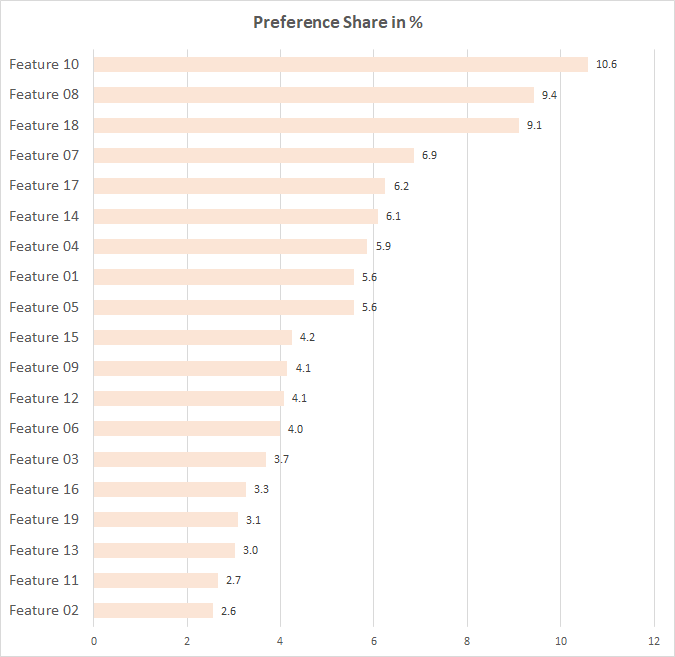
Reading note:
These two graphs enable us to quickly identify the characteristics that are most important to our respondents.
On the left chart, utilities scores are centered and then sorted by decrease order of performance from the feature with the highest utility to the lowest utility. To better understand performance differences between features, we have added confidence interval at 95%. Like features 10 & 7, two features may have differente averages with a strong gap but overlap on confidence interval. In this case, we could consider these 2 features to be equivalent.
On the right chart and after converted individual utilities to preference shares, features are sorted again by decrease order.
These 2 scores may provide different ranking. Nevertheless, the most popular group of features should be the same, as for the group of rejected features. During the analysis, you should keep one of this output only to avoid confusion in result exploitation.
While MaxDiff is powerful in isolating feature preference, it doesn’t directly tell us which combination of features will appeal to the broadest audience. This is where TURF analysis comes into play.
TURF Analysis: Maximizing Reach with the Right Combination of Features
Total Unduplicated Reach and Frequency (TURF) analysis is a technique used to assess the potential reach of different combinations of features or products. TURF answers a critical question, particularly when creating a product or service range: Which combination of features maximizes reach across a target audience while avoiding redundancy?
This approach is, for example, very useful for identifying the best products to include in your range, avoiding cannibalization effects.
How TURF Works?
✔ Reach Estimation (rchX) : TURF calculates how many people would find at least one feature in a given combination appealing, considering overlap in preferences across different features.
✔ Feature Combination Testing : The analysis tests different feature combinations to identify the set that achieves the greatest “reach” - meaning, how many unique individuals are satisfied by the combination.
✔ Frequency Assessment (frqX) : TURF compute also a frequency score which is the average number of features each respondents is attracted to for a specific combination. For example, in the case of a combination of 5 characteristics (A+B+C+D+E), respondents chose 2.1 on average.
Reading note:
The TURF algorithm will start to identify the first feature with the highest preference share. Then excluded respondents who have positive scores on the first feature selected, the TURF algorithm look for the second feature with the highest preference share on the remaing sample ... The TURF algorithm continue until the last feature have been identified. At each iteration, the TURF algorithm selects the characteristic to be retained, then calculates its additional contribution to the population having chosen at least one characteristic of the offer.
TURF analysis is particularly useful when it's essential to make decisions about which subset of all features will appeal to the maximum number of people.
For example, a food-industry producer of bagged herbal teas will be particularly helped by this TURF tool to define which fragrances should be included in its range of herbal teas, in order to optimize its product offering to its customers. Studying the potential of each candidate range, knowing its production costs, is an invaluable decision-making tool.
Combining MaxDiff and TURF: Optimizing Preference Share
When MaxDiff is used as input for TURF analysis, the two methodologies work synergistically to provide deeper insights. Here’s how the process works in practice:
Individual utilities computed in the MaxDiff are converted into choices probabilities. These probabilities are then used as input data set for the TURF algorithm.
By feeding these MaxDiff results into TURF analysis, we can explore various feature combinations to determine the set that will yield the highest reach and preference share. However, the TURF output typically offers several potential “best” combinations or candidates for feature sets.
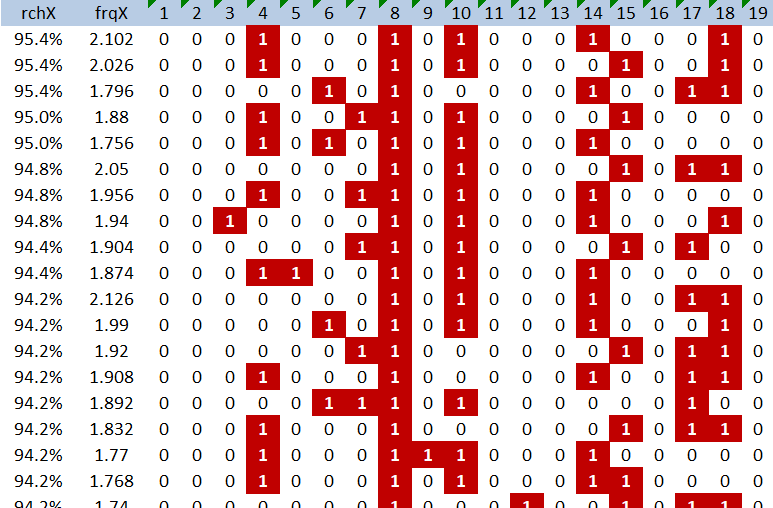
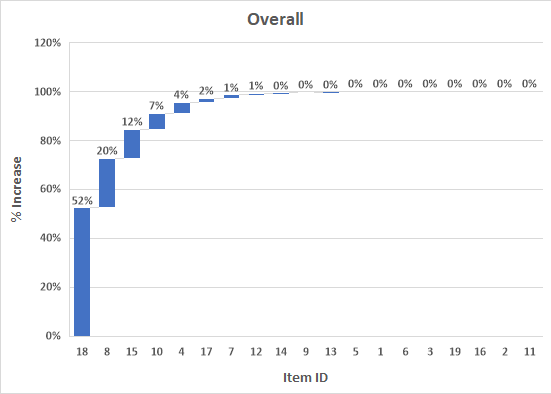
Reading note:
This listing provides different combinations of 5 features out of 19. We can consider the first rows of this listing as equivalent. Businesses have the choice between different solutions and may choose the final solution based on internal consideration or constraints. That is the beauty of the TURF. There is always several solutions to look at and consider based on company's constraints of strategy.
The first combination to be considered includes features 4, 8, 10, 14 and 18, with 95.4% of respondents choosing them, and an average of 2.1 features chosen at the same time per respondent. The second combination replaces feature 14 with feature 15, with 95.4% of respondents and, on average, 2.0 features chosen at the same time per respondent. These first 2 solutions are statistically equivalent. Internal production constraints will determine which solution is best for the company creating these products or services.
These candidate solutions allow decision-makers to choose the optimal combination of features not only based on customer preferences but also considering internal business parameters such as production costs, operational production constraints, strategic goals, or brand alignment.
Since these internal factors are often unknown to external analysts, the combination of MaxDiff and TURF provides a flexible decision-making framework that empowers organizations to tailor solutions based on their unique contexts. The multiple candidate solutions provided by TURF ensure that businesses can balance customer needs with operational realities.
Benefits of This Approach:
✔ Precision in Feature Selection: Combining MaxDiff and TURF ensures that you not only know which features are preferred but also which combination of features provides the maximum value.
✔ Maximizing Impact with Limited Resources: Instead of investing in developing all features, businesses can focus on the combination that will yield the greatest return, saving time and money.
✔ Data-Driven Decision Making: This approach turns subjective guesswork into objective, data-driven insights, giving you confidence in your feature selection.
✔ Flexibility in Final Decision: By offering several candidate solutions, this approach enables businesses to make informed decisions that align with internal constraints and strategic objectives.
Conclusion: The Power of MaxDiff and TURF for Feature Optimization
MaxDiff and TURF analysis together form a powerful toolset for any business looking to maximize customer satisfaction and reach with its product or service offerings. While MaxDiff helps identify the most preferred individual features, TURF goes a step further by revealing the ideal combination of features that will maximize reach and impact.
At Stat & More, we help businesses unlock the full potential of these methodologies, ensuring that their products are designed with the best possible combination of features. By leveraging MaxDiff and TURF, you can make confident, data-driven decisions that maximize both customer satisfaction and market potential.
Ready to Optimize Your Next Product or Service?
If you’re interested in learning more about how MaxDiff and TURF analysis can help your business make smarter, more strategic decisions, contact us at Stat & More today. Our team of experts is ready to guide you through the process and ensure you achieve maximum results.
Let’s take your products or services to the next level, together!
RESSOURCES Wikipedia contributors:
✔ (2024, 25 novembre). �chelle de likert. https://fr.wikipedia.org/wiki/%C3%89chelle_de_Likert
✔ (2024, March 19). MaxDiff. Wikipedia. https://en.wikipedia.org/wiki/MaxDiff
✔ (2024, August 29). Conjoint analysis. Wikipedia. https://en.wikipedia.org/wiki/Conjoint_analysis
✔ (2022, July 25). TURF analysis. Wikipedia. https://en.wikipedia.org/wiki/TURF_analysis
✔ (2024, August 23). Bayesian hierarchical modeling. Wikipedia. https://en.wikipedia.org/wiki/Bayesian_hierarchical_modeling