Correlation is a statistical indicator widely used in data analysis, particularly in marketing sciences for satisfaction surveys for example, in tracking context or not, for product or service’s innovation, brand images etc.
In this article, we want to discuss and precise correlation usage in survey universe. We will then suggest more suitable alternatives depending on the strategic level of the study.
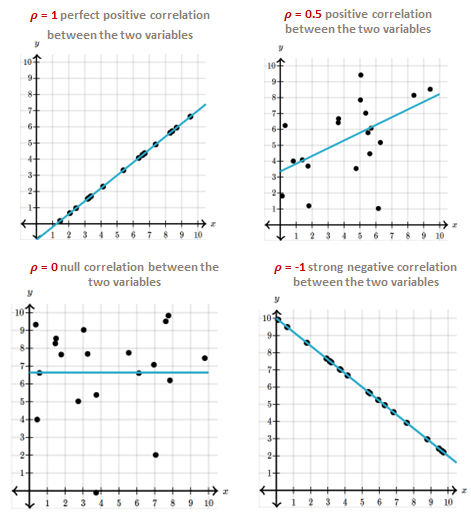
The correlation, in the sense of Spearman, is a statistical tool that measures the relationship between 2 variables.
✓ A positive correlation means that 2 variables vary simultaneously in the same direction.
✓ A negative correlation means that 2 variables vary simultaneously in the opposite direction.
✓ A nulle correlation means that 2 variables are independent of each othere.
Correlation is a statistical indicator commonly used in marketing sciences to assess the importance, the impact, of one variable on another. In this sense, the use of correlation allows us to bypass the cognitive biases inherent to human nature when we ask respondents directly in a study context. Without asking a question of stated importance directly to the respondents, we can still, in a derivative way, calculate this importance between two variables via the calculation of the correlation.
Not asking the questions directly to the respondents allows to optimize the size of the questionnaire in a survey context.
Correlation can be used to :
✓ Identify the strength of the relationship of one variable to another,
✓ Prioritize the variables, by their level of correlation on a target variable, in relation to each other,
✓ Edit an importance / satisfaction matrix,
✓ Choose the variables to be included in a prediction model,
✓ ...
However, the use of correlation has its limitations. In particular, the correlation :
✗ Does not mean causality,
✗ Can be influenced by exogenous data,
✗ Does not take into account interactions between variables.
Furthermore, in a tracking study context, the use of correlation in the analysis phase, may prove counterproductive.
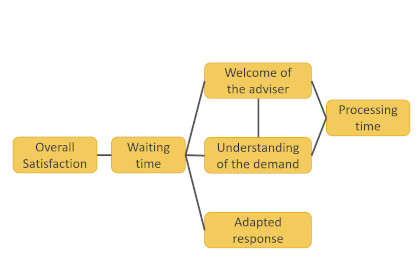
Let’s imagine that during an initial analysis, the correlation allowed to identify the satisfaction drivers. Your customer implements an action plan to work on these drivers.
A second survey shows a significant improvement in the performance of these drivers. Doing so, and in a completely mechanical way, the variance of these variables decreases. The correlation of these drivers with satisfaction therefore also decreases, tending towards a relative independence of these variables.
The customer then concludes that other drivers are to be worked on priority in a new action plan, and puts aside the initial satisfaction drivers.
Here is the error of interpretation.
There are other statistical indicators or tools that allow you to get the most out of the data collected and avoid the pitfalls of using correlation. We present here 3 alternatives, from the simplest to the most complex, from the cheapest to the most expensive but with a very high added value:
✓ Partial correlations:
Measures the relationship between two variables while controlling for the influence of other variables included in the analysis = accounts for interactions between variables. This indicator provides a more nuanced understanding of the relationship between two variables.
However, this tool does not make it possible to identify causalities and their meaning, and is very dependent on the variables included in the analysis, i.e. potentially influenced by exogenous data.
✓ Equations in structural model:
A statistical tool used to represent and analyze causal relationships between variables. Structural model equations use a combination of factor analysis and multiple regression to determine and estimate relationships between variables.
Structural model equations do not always accurately represent the complex relationships between variables and may be sensitive to missing data or incorrect model specifications set by the analyst.
✓ Bayesian networks:
This tool allows to represent and analyze the causal relationships between the variables injected in the analysis. This tool uses a probabilistic approach and Bayesian inference to represent and highlight the relationships between the variables analyzed.
Bayesian networks can:
✔ Represent complex relationships between variables,
✔ Managing missing data and uncertain relationships,
✔ Be updated as new data becomes available.
However, Bayesian networks have some drawbacks:
✗ The implementation can be time consuming,
✗ Its use may require specialized knowledge to specify the structure and probabilities of the network,
✗ And therefore, higher implementation costs.
In this article, we have briefly discussed the notion of correlation and its possible limitations, as in the case of tracking studies. We have suggested 3 tools to get around the limits of correlation.
Beyond the alternatives seen above, there are between the very simple, and the more complicated with Bayesian networks, very affordable tools, such as the attributable effects, the difference driver analysis, the Llosa matrix in the case of satisfaction survey ... and still many other tools to identify the variables that should be worked in your action plans.
You need support to find in your data the drivers to improve your performance indicators, contact us.